

So recently I found my way over to the Virginia Department of Elections to check my registration status. I have never dwelled too long in the website before, but I found myself inquisitive that day. It’s a very nice website and props to the designers for it’s concise nature. The site contains information and results of Virginia Elections going back to at least 2005 including an interestingly named file called “All-time Top Vote Getter”. The link to this file is here: Virginia All-time Top Vote Getter.
VAvotes.head()
| Candidate | PoliticalParty | ElectionYear | OfficeSought | IsIncument | TotalVotes | |
|---|---|---|---|---|---|---|
| 0 | Mark R. Warner | Democratic | 2020 | Member United States Senate | True | 2466500 |
| 1 | Joseph R. Biden | Democratic | 2020 | President and Vice President | False | 2413568 |
| 2 | Mark R. Warner | Democratic | 2008 | United States Senate - 2001 CD Lines | False | 2369373 |
| 3 | Timothy M. Kaine | Democratic | 2012 | Member United States Senate | False | 2010067 |
| 4 | Hillary Clinton | Democratic | 2016 | President and Vice President | False | 1981473 |
Now this information is pretty interesting on it’s own, we can get a better understanding by looking at a more timeline oriented approach. This is also better organization for how I plan to modify the data later. We also destroy the old index as it doesn’t really serve our purposes.
VAvotes = VAvotes.sort_values(by = "ElectionYear")
VAvotes.reset_index(inplace=True)
del VAvotes['index']
VAvotes.head()
| Candidate | PoliticalParty | ElectionYear | OfficeSought | IsIncument | TotalVotes | |
|---|---|---|---|---|---|---|
| 0 | J WARNER | Republican | 1996 | United States Senate - 2001 CD Lines | False | 1179088 |
| 1 | CLINTON | Democratic | 1996 | President and Vice President - 2001 CD Lines | False | 1039983 |
| 2 | M WARNER | Democratic | 1996 | United States Senate - 2001 CD Lines | False | 1064119 |
| 3 | DOLE | Republican | 1996 | President and Vice President - 2001 CD Lines | False | 1086819 |
| 4 | C ROBB | Democratic | 2000 | United States Senate - 2001 CD Lines | False | 1233185 |
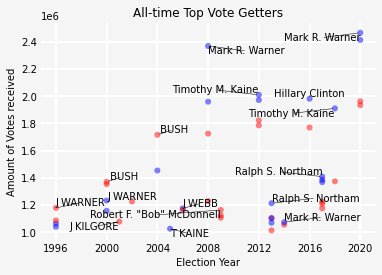
We can see in the below graph that most of these politicians achieve a lot of votes every 4 years- when presidential elections occur. An example of this phenomenon can be very clearly seen by comparing the votes that Mark R. Warner achieved in 2008 and 2020 to his performance in 2014. It’s not news that presidential elections are more competitive than elections over the House or even some Senate seats but the number of votes is almost half of what was achieved during a presidential election. I only highlighted the politicians that did the best in a respective year as I found including more names made the graph nearly incomprehensible.
We also have a few problems using this data set with pandas. The year ranges are not the same but this one is minor. The larger one is that some politicians are featured several times in the data set, and determining the politician with the most votes for that year was a bit of a chore. We eventually did the following:
nameMaxValue = []
votes = []
for Year in VAvotes["ElectionYear"].unique():
    n = VAvotes["TotalVotes"][pd.Index(VAvotes["ElectionYear"]).get_loc(Year)]
    if type(n) == numpy.int64:
        largeval = n
    else:
        largeval = max(VAvotes["TotalVotes"][pd.Index(VAvotes["ElectionYear"]).get_loc(Year)])
    votes.append(largeval)
    nameMaxValue.append(VAvotes["Candidate"][pd.Index(VAvotes["TotalVotes"]).get_loc(largeval)])
So we now had two lists corresponding to the year and politician name. Essentially this script loops through the years within the .csv and finds the most votes of that year. Using this information, it then finds the name of that individual as we assume that the number of votes is unique. If this was not the case then we might have a problem but I think it is a fair assumption. We also did a simple coloring schema. Might have been better to use a switch statement here but c’est la vie:
Polparty = []
for i in VAvotes["PoliticalParty"]:
    if i == "Republican":
        Polparty.append('r')
    elif i == "Democratic":
        Polparty.append('b')
    else:
        Polparty.append('g')
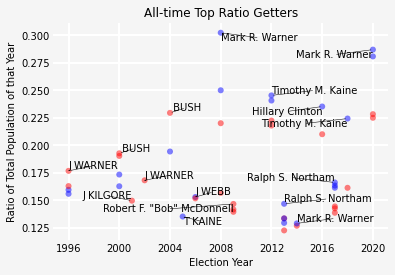
Now obviously voting demographics change over time but I think that this current interpretation favors more recent politicians as more people in Virginia are able to vote. To confirm this, I looked at population growth estimates for Virginia provided here: Virginia Population 1900-2020. It is important to note that not every individual is eligible to vote. Some are restricted because of age or simply because they are not registered. We are making an implicit assumption that the proportion of population that is eligible to vote is approximately the same over this time scale. I’m not sure if this fact can be verified but I might make a follow-up if that is not the case. We obtain this ratio by simply taking the year population found by this estimate and apply it to the votes obtained by each politician. Again, we have a problem that for each year, we have multiple people and thus votes to process.
temp = []
for i, Year in enumerate(VAvotes["ElectionYear"].unique()):
    n = VAvotes["TotalVotes"][pd.Index(VAvotes["ElectionYear"]).get_loc(Year)]/VApop[" Population"][pd.Index(VApop["date"]).get_loc(str(Year))]
    if hasattr(n, "__len__") and (not isinstance(n, str)):
        for j in n:
            temp.append(j)
    else:
        temp.append(n)
VAvotes["VoteRatio"] = temp
You may have to clean the population data a bit as the date formatting is a little different than the most votes of all time. We also add an additional column for this information. As expected, applying population growth to this data produces a seesaw correction where politicians on the left side receive a little bit of a boost while on the right, there is a bit of a reduction.
The entire script can be found on this GitHub and I have also uploaded the .csvs that I used as comparators: Get the Git!